
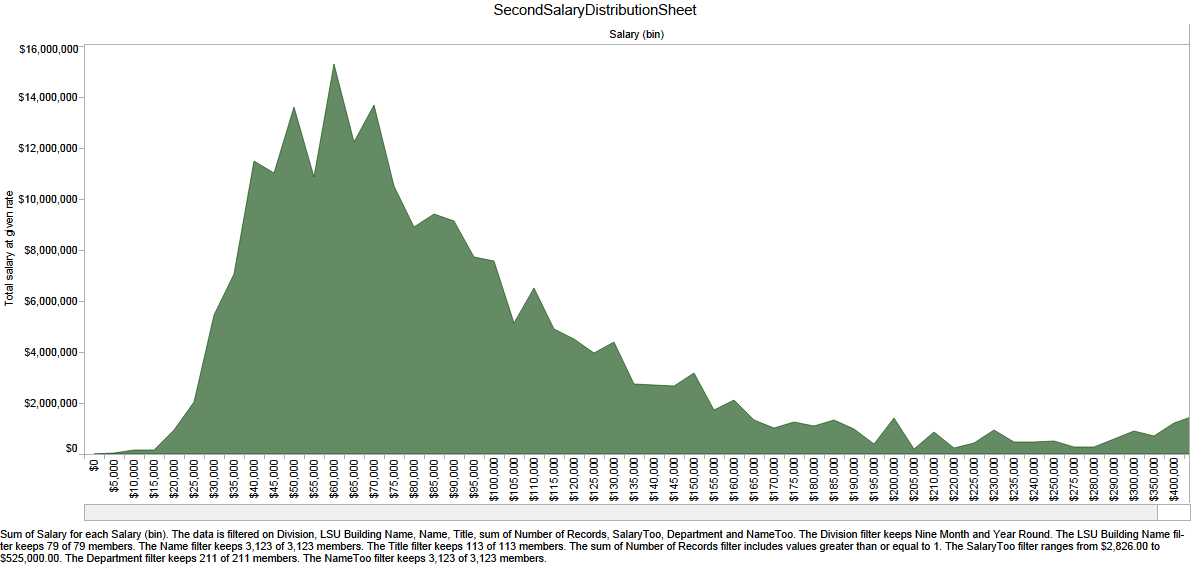
Tableau viz shows how much, total, was spent on salaries in each salary range.
I love this one. It shows how much money, total, is spent to pay the salaries of LSU employees with salaries in a given range.
I’ll also include the link to the Tableau viz. It lets you play with switching between nine month and annual salaried employees. Nine month employees tend to be faculty, year round tend to be staff, but that’s only a very general rule of thumb.
http://public.tableausoftware.com/views/manualmap2test/SecondSalaryDistributionSheet?:embed=y&:display_count=no
As always, it’s the side stories I find fascinating with these projects.

