One hears about liberal bias in education on a regular basis – but is it true? Just how liberal *is* LSU?
 Not very, as it turns out.
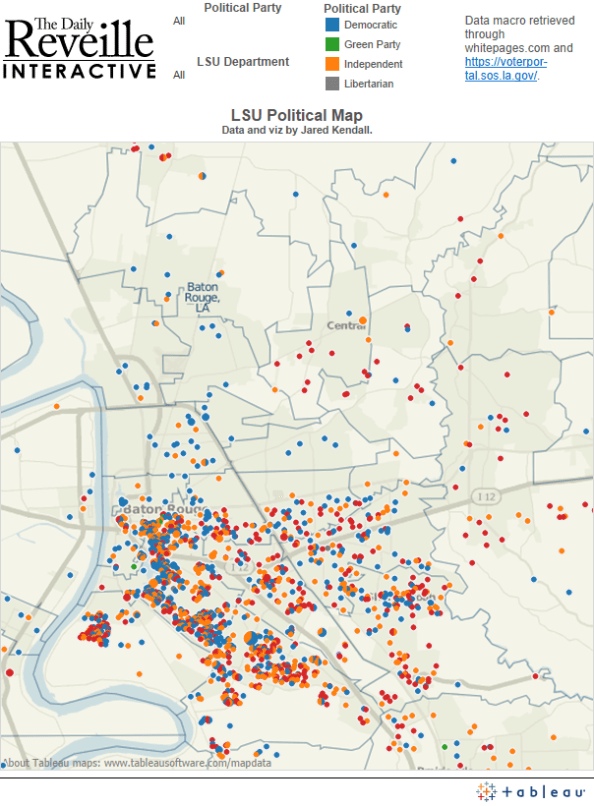
After running every name from the Reveille’s database of faculty and staff to retrieve their political party affiliations, I found that the LSU faculty is actually about 10 percentage points less Democrat-leaning than the surrounding Parish. The data says that LSU is no hotbed of liberalism – and it also showed we had a Monarchist. That one came as a surprise.
Working with Fernanda Zamudio-Suarez, my favorite reporter at the Reveille, we put together a great package showcasing the results and the implications of those results. Fern even knew the Monarchist – Faculty Senate President Kevin Cope – and got him to open up about his party affiliation.
The data was a blast, and it showed all sorts of fascinating things. The most liberal department on campus, unsurprisingly, was Music & Dramatic Arts, where 71.79 percent of the faculty & staff are registered Democrats (of those I was able to retrieve party affiliation for). The least liberal department, was UC Advising & Counseling, where 20 percent of the staff are Democrats, and 46.67 percent are Republicans.

To me, this is the perfect example of how data journalism should be done. We took a dataset we owned – the salary database for the university – and leveraged it into a brand new story, and a brand new insight, simply by running it through a new source of information. Data is all about recombinant information – the mutational evolution of your understanding of the world.
Plus, we found a Monarchist. I don’t think that’s ever going to get old.
Now, I just need to find a new, fun data project to feed Fern – I’m sure she’s disappointed I haven’t kicked anything good her way in quite some time.
One final addendum – after publishing, a friend of a friend asked about what would happen if we had zeroed in on the faculty alone – rather than faculty & staff together. I can’t do that breakdown perfectly, but I can approach it, and when I do it shifts the numbers by a bit less than 3% toward Democrat affiliation. The new numbers, if I’m trying to just grab them for faculty without staff, run 40.77% Democrat, 25.47% Republican, and 33.03% Independent. Don’t let the apparent precision of those percentages fool you — they’re my best attempt at faculty isolation, but they’re not perfect. Even these isolated numbers, however, fail to achieve a strong liberal bias. If you want strong bias, your best bet remains looking at different departments. Music & Dramatic arts, I’m looking at you.
Special thanks to professor Rosanne Scholl for pointing out that whatever my personal feelings on the matter, the major political parties remain proper nouns and deserving of capitalization. Thanks as well go out to Barbara Clark, who asked the question I failed to consider: How do the numbers change if you look at faculty separate from staff?