Big Data, noun: The re-purposing of one or more comprehensive datasets to generate a new, comprehensive dataset describing information not available in the original dataset(s).
An example would be taking voter records for a locality, and cross-referencing them with gun registrations to arrive at gun ownership rates by party affiliation. This new dataset was not the purpose of either source set. Both have been repurposed, and the result, if comprehensive, is an example of big data. Big data also implies a responsibility to include as much data as possible. The same project, if it chose to discard Republican and Democratic gun owners while keeping independents, would not meet the standard of big data. Big data is comprehensive. Anything else is just data. And “just data” doesn’t tell us nearly enough.
Definitions are important. I’ve heard a lot of definitions of big data, and I’ve never heard one that I thought nailed it. In fact, most definitions sound like they’re frustrated, themselves, with the state of affairs. They’re cobbled together descriptions of symptoms, not a fundamental set of rules that tell us what this new thing truly is. I may be wrong about what big data is, but I suspect I’m on the right track.
Big data needs to be big, and it needs to change the way we investigate information. With data being generated at such breakneck speed, the world can’t afford to look at it a tiny bit at a time. We need to gorge on it, digest vast chunks, and aggregate the small truths you can’t see if you only look at part of the story.
Big data is about seeing the trees *because* you see the forest, and it implies that if you *don’t* see the forest, there’s no way you can truly understand the trees.

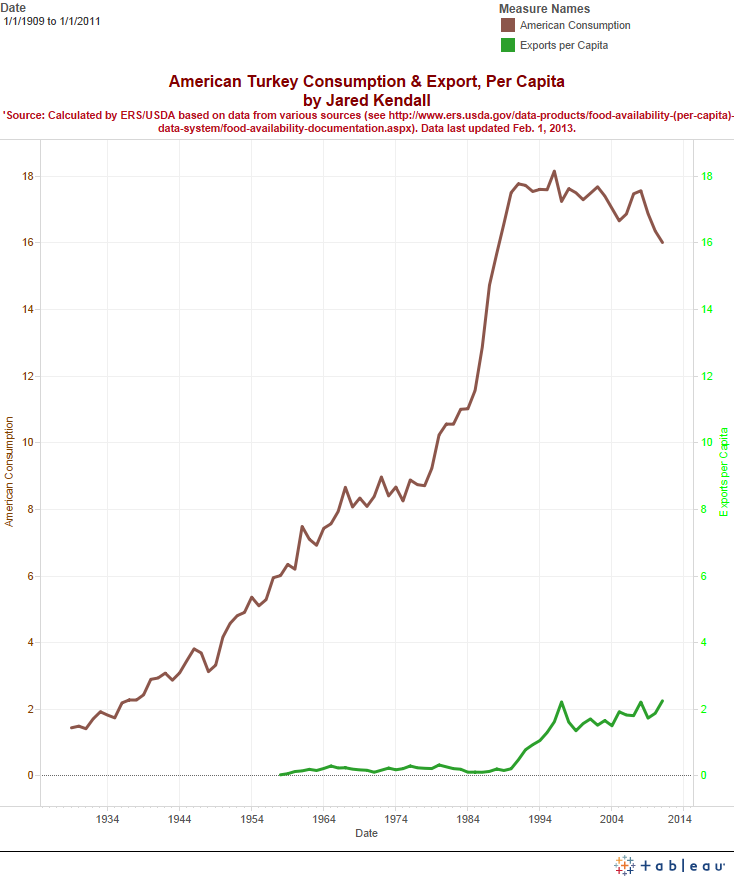
 As we sit down to feast and avoid picking a fight with Uncle Pete, why not take a moment to reflect on all the great turkeys to go before? America hasn’t always eaten so much turkey, but after a mad dash to the top, the bird has apparently hit some sort of glass ceiling… Or glass coop, at least. Domestic consumption has leveled off, and only increases in exports appear to show much hope for turkey sales to really take flight.