So many ISPs, so little choice

When I recently got the chance to play with some data on Internet Service Providers courtesy of Decision Data, one of the biggest questions on my mind was this: Just how many companies compete for our business?

competing-coverage

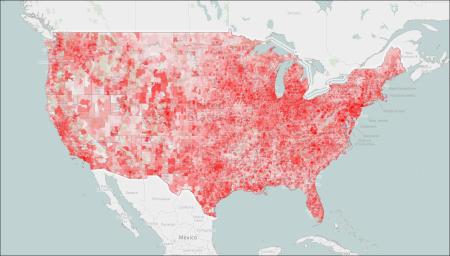
Turns out, numerically speaking, quite a few. Decision Data has stats on a whopping 2,345 providers nationally. This means that plenty of zip codes have a lot of competition – on paper. It’s when you really look at that competition that you realize it’s not all that it’s cracked up to be.

Right off the bat, there’s wireless. Wireless internet access is fine (I happen to use it myself) but it isn’t exactly perfect. If you need or want to download a lot of data in a month, you’ll hit your cap pretty quick on most wireless plans (or pay a small fortune.)

So I’m not sure we can count all of those cell phone providers as true ISPs. Sure, a lot of us get a lot of data delivered via cell phone tower — but most of us need an Internet that won’t run out of capacity if we decide to binge watch Buffy.
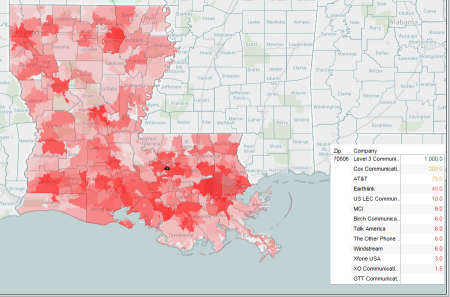
You also have commercial/business providers like Level 3 Communications. I’ll  bet they’re fast and allow plenty of data per month – and I’ll bet they wouldn’t be interested in a small-fry customer like me, even if I *do* refer to myself as a business. (It’s a freelance thing.) In fact, the number of business providers came as something of a surprise to me — apparently, businesses have plenty of choices. We consumers, it would seem, not so much.

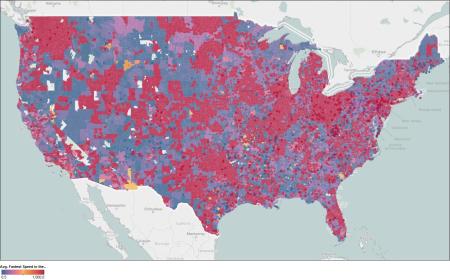
Side note: In spite of how awful our Internet speeds are supposed to be when compared to places like South Korea, my map of the highest speeds available by zip shows that (theoretically, anyhow) much of America has access to gigabit-speed Internet. In the map below, red is fast, blue is slow.

the-fasts-and-the-fast-nots

My zip code has 13 different providers, in theory. Out of all of them, I think only three would be real “choices” for me, and last time I checked only one of them actually reaches my apartment – which means the other choices aren’t actual choices at all. Not unless I go run a couple thousand feet of Cat 5 cable to the nearest spot an alternate provider *does* reach.

70806-isps

So I’ve basically got the one choice, if I want to move away from my grandfathered (and truly unlimited) wireless data plan. Like most Americans, when it comes to Internet access, I’m overwhelmed with options but underwhelmed by most of them.

But at least it ain’t dial-up.

No neutrality for Swiss Americans

Swiss_AmericansSoon I’ll wrap this series up – but first, we need to take a look at Swiss-Americans, and their reverence for the Mason-Dixon line.

The Swiss aren’t particularly common in America, but they’re notably sparse in the South. Apparently, whatever brought those with Swiss ancestry to the United States didn’t involve a love of sweet tea and kudzu.

Link to full Swiss tableau: https://public.tableausoftware.com/views/supercensus/SwissAmericans?:embed=y&:display_count=no

Hispanic America is a Mexican America

Hispanic_AmericaToday we look past the general term Hispanic to see where America’s Hispanics truly come from. Calling someone “Hispanic” is like calling them “European.” It speaks somewhat to their ancestral heritage, but encompasses a *very* broad swath of very different folks.

Yet as we see when we map the United States by most populous Hispanic sub-type for each zip code, we find the Hispanic population of America is, overwhelmingly, Mexican.

To arrive at this took a very tedious formula. I’m sure there’s some better way to do it, but the only way I knew was with an IF, AND, THEN, ELSE statement. Basically, for each sub-type, I made a formula that said, “If there are more of this group than that group, and that group, and that group, and that group (etc.) then this group is the biggest group in the zip code.” If the group wasn’t the largest, the code looked at the next one. And so forth, and so on. Here is the code for just one of the ethnic groups I looked at:

if [Guatemalan]>[- Cuban] and [Guatemalan]>[- Dominican (Dominican Republic)] and [Guatemalan]>[- Mexican] and [Guatemalan]>[- Other Hispanic or Latino: – Spaniard] and [Guatemalan]>[- Other Hispanic or Latino: – Spanish] and [Guatemalan]>[- Other Hispanic or Latino: – Spanish American] and [Guatemalan]>[- Puerto Rican] and [Guatemalan]>[Argentinean] and [Guatemalan]>[Bolivian] and [Guatemalan]>[Chilean] and [Guatemalan]>[Colombian] and [Guatemalan]>[Costa Rican] and [Guatemalan]>[Ecuadorian] and [Guatemalan]>[Honduran] and [Guatemalan]>[Nicaraguan] and [Guatemalan]>[Other Central American] and [Guatemalan]>[Other South American] and [Guatemalan]>[Panamanian] and [Guatemalan]>[Paraguayan] and [Guatemalan]>[Peruvian] and [Guatemalan]>[Salvadoran] and [Guatemalan]>[Uruguayan] and [Guatemalan]>[Venezuelan] then “Guatemalan”

Here’s a link to the Tableau tool: https://public.tableausoftware.com/profile/jared5561#!/vizhome/themexicans/HispanicAmerica

Hispanic America

Hispanic_AmericaI started this series, in part, because of the fact that immigration and citizenship have been in the news lately. While my maps have focused on every aspect of the American ancestral makeup, the portion of our tapestry which is currently under debate is the one I look at today – Hispanic-Americans. Hispanic is a broad category, and I plan to publish a more detailed map of Hispanic America which will show not only where Hispanics live, but where Hispanics from various nations live. After all, Hispanic is just a category – it encompasses a lot of nationalities, and lumping them together ignores this varied heritage. Keep checking my site – at the moment, I intend to have that new, more detailed map ready tomorrow.

Hispanic settlement isn’t particularly surprising, although I do find it odd how quickly numbers drop off when you cross the Louisiana-Texas border.

Enjoy, and here’s the link to the Tableau tool, so you can explore: https://public.tableausoftware.com/views/supercensus/HispanicAmerica?:embed=y&:display_count=no

Slovak-Americans

slovaksSlovaks can be found, for the most part, in a band which stretches from the Ohio Great Lakes east through Pennsylvania and parts of New York State.

Not particularly plentiful, and largely absent from much of the country, I decided to break with tradition and crop the Slovak map just a bit to make it easier to see the spots where they settled. The map isn’t perfect – one flaw is that I would need to make the coloration layer transparent if I wanted to allow city names and so forth to come through – but doing so makes it more difficult to spot the ethnic density coloration, so I’ve resisted the temptation up to this point. Try the Tableau tool so you can mouse over spots and get geographic information.

Link to Tableau tool:

Swedish-Americans

Swedish_AmericansIf you want to find Swedes in America, head to Minnesota. While Swedes can be found across the plains states, they are concentrated in the Minnesota region.

Link to full tool: https://public.tableausoftware.com/views/supercensus/SwedishAmericans?:embed=y&:display_count=no

Russian Americans

RussiansI expected to see a strong concentration of Russians on the East Coast near New York City, for whatever reason. I was wrong. The region of the United States with the highest percentage of Russian ancestry is actually off in the Dakotas – perhaps testimony to the Russian ability to live through blistering summers and polar winters… Or perhaps not. Either way, I was surprised by the results – and that’s always a good thing.

Link to full Tableau tool:

Portuguese-Americans

Portuguese_AmericansThe Portuguese favor two locations in the United States – Massachusetts, and Southern California. Outside of those small enclaves, they’re nearly nonexistent, creating a vast empty expanse when mapped.

I would imagine someone with some knowledge of Portuguese history could shed some light on why their descendents are found in those areas – the map, as it stands, is just a tantalizing clue in need of further explanation.

Link to full Tableau tool:

Lithuanian Americans

Lithuanian_AmericansIf you’re a Lithuanian in America,  you are not alone. But you’re close. Lithuanians are few and far between, representing one of the smaller demographic segments of the population.

In fact, out of fifty ethnic and racial ancestral demographics, Lithuanians came in tied for #36 in my list of ethnicities with the greatest number of zip codes where they’re the largest ethnic component. There was one zip code in the United States where there were more Lithuanians than any other ethnicity – zip code 17974, in Schuylkill, Pennsylvania. In that single zip code, Lithuanians make up 29.6% of the population. Go Schuylkill! Of course, that isn’t even a proper zip code – it’s a p.o. box zip code, which means it doesn’t show up as an area on my map – it shows up as a little circle that’s difficult to spot. Think of hunting for it as a Lithuanian version of “Where’s Waldo?”

Here’s a link to my Lithuanian Tableau tool:https://public.tableausoftware.com/profile/jared5561#!/vizhome/supercensus/LithuanianAmericans

Norwegians in America – our northern plains brethren

Norwegian_AmericansSome ethnic groups spread out to fill every nook and cranny in the United States – Germans, I’m looking at you! Others, like the Norwegians, stick to one region and don’t stray far. For the Norwegians, the northern stretches of the Great Plains clearly holds a special attraction.

Link to Tableau tool: https://public.tableausoftware.com/views/supercensus/NorwegianAmericans?:embed=y&:display_count=no