Featured

College Students on Ashley Madison

“Grace” was in a religion class when she opened up her e-mail and found out that someone had pranked her by making her an account on Ashley Madison, the infidelity-themed web site. She’d had no idea until that day in April, 2013 when she looked through her e-mails and saw that three men on the site had sent her “winks.”

ashley madison account hidden confirmWithin the day, she’d requested that Ashley Madison delete her account. They agreed, and told her it would be “hidden” from the service. It wasn’t until Grace was contacted for this story that she even realized her data was still out there, and had become part of the Ashley Madison data breach and leak.

The 7 Year Itch everyone

Age distribution at the time of joining Ashley Madison, based on data from the Ashley Madison leaked databases. Men in orange, women in blue.

While the majority of Ashley Madison users were older, the site boasted millions of members, and drew that membership from all age ranges – including college students. At first, this seems strange, given that few college students are married. Therefore, they wouldn’t seem like the natural demographic to join a site whose motto is, “Life is short, have an affair.”

However, what college students lack in married malaise, they more than make up for in curiosity. Joshua Ullom seems to typify this group, saying that he and some friends made an account for “drunken laughs.” They didn’t talk to anyone on the site, and Ullom says that the absurdity of the entire thing was hard to get past.

“We were just talking about how crazy the whole concept of the website was and just wanted to look around.”

Other stories are similar. Most report being curious or bored, or stunned that such a brazen infidelity site could exist. Several hinted that they might have really tried the site, but refused to take part in the story.

Then there’s Bryan Pauley.

Pauley was a student at Kent State university when he signed up, and he signed up hoping to meet women. He said that he was intrigued by the site’s “guaranteed” results. Having tried several free dating sites at the time and found that they seemed filled by people who were “catfishing,” Pauley decided that he would try something else, and see if a paid dating site was any better.

Ashley Madison and women at signup

Distribution curve for women. Very similar to men, including the spike of membership from people who were 36 (or *claimed* they were 36) when they signed up.

Pauley’s hopes were disappointed.

He quickly found himself interacting with strange profiles that seemed to just “string you along.”

He said that these profiles all followed a similar pattern: A woman would message him, but refuse to ever send new pictures, or talk on the phone, or meet, or even chat on AOL Instant Messenger, which he said was very popular at the time.

Pauley believes that one of the profiles he exchanged messages with was an actual, honest, breathing woman – unlike the others, which he said he believes might have been fake profiles, meant to keep him interested and on the site. This seemingly authentic woman reported that she’d gone on a few dates with men she met through Ashley Madison, but the men were always “too aggressive.” Eventually, she stopped talking to Pauley, and after three months or so, Pauley closed his account and gave up on Ashley Madison.

The 7 Year Itch men

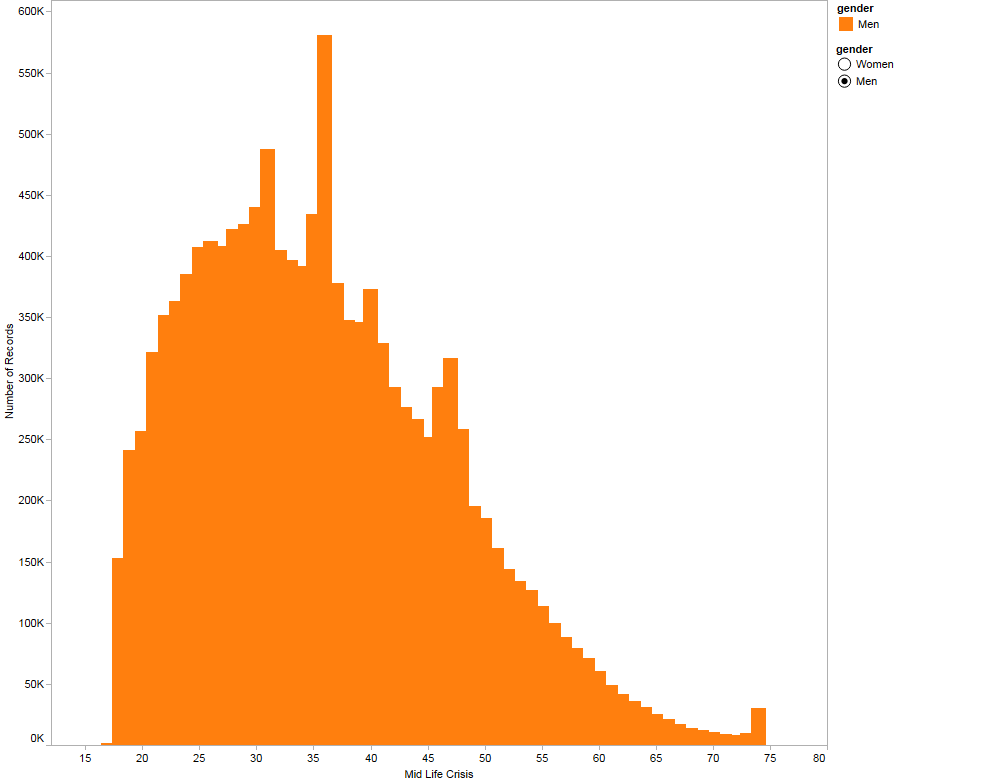
Age distribution for men when they joined Ashley Madison. Same jump at age 36, and if you compare the *scale* of the male distribution curve, you’ll see that there’s roughly a five-fold difference in the number of men than women on the site. This may explain some of the “aggresssion” the woman Pauley corresponded with described.

“I just canceled it, and didn’t try online dating for several years,” Pauley said.

Others said that they never went as far as Pauley, with many saying that they quit as soon as they realized they’d have to pay to properly join.

Anthony Buck, a student at the University of Alabama at the time, said he signed up because his friends were hanging out and couldn’t believe that there was actually a site specifically for having an affair.

“My friends and I were all gathered around, and I guess I was the guinea pig,” Buck said. “I signed up once, and never got on again. I’m pretty sure I wasn’t even able to view anything ’cause I wasn’t about to pay for the membership.”

Grace’s single day of membership was more than enough for her. She says she’s offended that her data is still out there, that this prank profile has come back from her past.

“I said, please, permanently remove anything associated with this name and this e-mail address, and they didn’t,” Grace said. “That’s not okay. I don’t like that. I know they suck.”

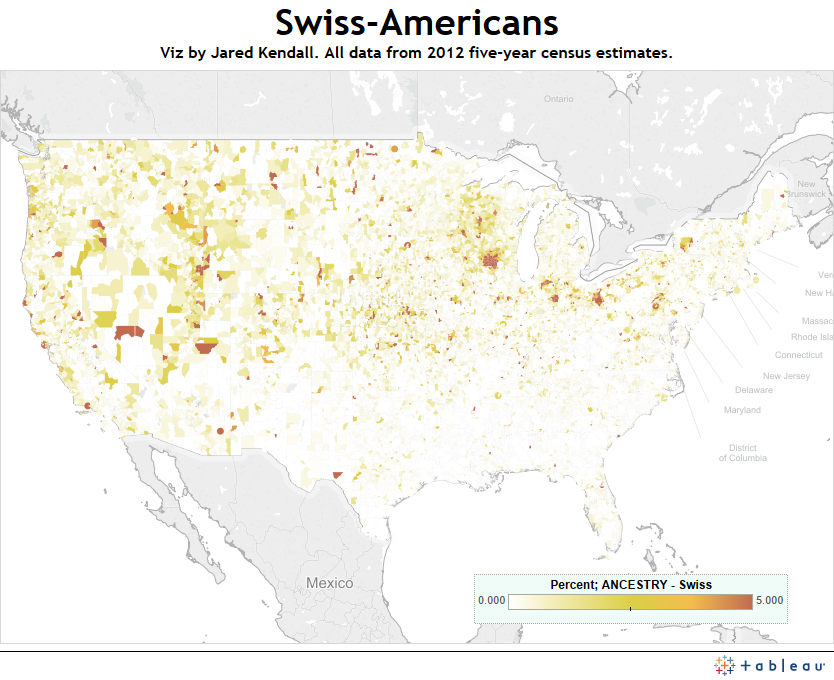
Click on the map below to get an interactive view of colleges around the country with e-mail addresses in the leak!

Map shows total number of matching e-mail addresses for colleges and universities across the country. Note that there is no way to know how many of those e-mail addresses were used deliberately by their owners.

Map shows total number of matching e-mail addresses for colleges and universities across the country. Note that there is no way to know how many of those e-mail addresses were used deliberately by their owners.

Advertisement

No neutrality for Swiss Americans

Swiss_AmericansSoon I’ll wrap this series up – but first, we need to take a look at Swiss-Americans, and their reverence for the Mason-Dixon line.

The Swiss aren’t particularly common in America, but they’re notably sparse in the South. Apparently, whatever brought those with Swiss ancestry to the United States didn’t involve a love of sweet tea and kudzu.

Link to full Swiss tableau: https://public.tableausoftware.com/views/supercensus/SwissAmericans?:embed=y&:display_count=no

Hispanic America is a Mexican America

Hispanic_AmericaToday we look past the general term Hispanic to see where America’s Hispanics truly come from. Calling someone “Hispanic” is like calling them “European.” It speaks somewhat to their ancestral heritage, but encompasses a *very* broad swath of very different folks.

Yet as we see when we map the United States by most populous Hispanic sub-type for each zip code, we find the Hispanic population of America is, overwhelmingly, Mexican.

To arrive at this took a very tedious formula. I’m sure there’s some better way to do it, but the only way I knew was with an IF, AND, THEN, ELSE statement. Basically, for each sub-type, I made a formula that said, “If there are more of this group than that group, and that group, and that group, and that group (etc.) then this group is the biggest group in the zip code.” If the group wasn’t the largest, the code looked at the next one. And so forth, and so on. Here is the code for just one of the ethnic groups I looked at:

if [Guatemalan]>[- Cuban] and [Guatemalan]>[- Dominican (Dominican Republic)] and [Guatemalan]>[- Mexican] and [Guatemalan]>[- Other Hispanic or Latino: – Spaniard] and [Guatemalan]>[- Other Hispanic or Latino: – Spanish] and [Guatemalan]>[- Other Hispanic or Latino: – Spanish American] and [Guatemalan]>[- Puerto Rican] and [Guatemalan]>[Argentinean] and [Guatemalan]>[Bolivian] and [Guatemalan]>[Chilean] and [Guatemalan]>[Colombian] and [Guatemalan]>[Costa Rican] and [Guatemalan]>[Ecuadorian] and [Guatemalan]>[Honduran] and [Guatemalan]>[Nicaraguan] and [Guatemalan]>[Other Central American] and [Guatemalan]>[Other South American] and [Guatemalan]>[Panamanian] and [Guatemalan]>[Paraguayan] and [Guatemalan]>[Peruvian] and [Guatemalan]>[Salvadoran] and [Guatemalan]>[Uruguayan] and [Guatemalan]>[Venezuelan] then “Guatemalan”

Here’s a link to the Tableau tool: https://public.tableausoftware.com/profile/jared5561#!/vizhome/themexicans/HispanicAmerica

Hispanic America

Hispanic_AmericaI started this series, in part, because of the fact that immigration and citizenship have been in the news lately. While my maps have focused on every aspect of the American ancestral makeup, the portion of our tapestry which is currently under debate is the one I look at today – Hispanic-Americans. Hispanic is a broad category, and I plan to publish a more detailed map of Hispanic America which will show not only where Hispanics live, but where Hispanics from various nations live. After all, Hispanic is just a category – it encompasses a lot of nationalities, and lumping them together ignores this varied heritage. Keep checking my site – at the moment, I intend to have that new, more detailed map ready tomorrow.

Hispanic settlement isn’t particularly surprising, although I do find it odd how quickly numbers drop off when you cross the Louisiana-Texas border.

Enjoy, and here’s the link to the Tableau tool, so you can explore: https://public.tableausoftware.com/views/supercensus/HispanicAmerica?:embed=y&:display_count=no

Swedish-Americans

Swedish_AmericansIf you want to find Swedes in America, head to Minnesota. While Swedes can be found across the plains states, they are concentrated in the Minnesota region.

Link to full tool: https://public.tableausoftware.com/views/supercensus/SwedishAmericans?:embed=y&:display_count=no

Russian Americans

RussiansI expected to see a strong concentration of Russians on the East Coast near New York City, for whatever reason. I was wrong. The region of the United States with the highest percentage of Russian ancestry is actually off in the Dakotas – perhaps testimony to the Russian ability to live through blistering summers and polar winters… Or perhaps not. Either way, I was surprised by the results – and that’s always a good thing.

Link to full Tableau tool:

Portuguese-Americans

Portuguese_AmericansThe Portuguese favor two locations in the United States – Massachusetts, and Southern California. Outside of those small enclaves, they’re nearly nonexistent, creating a vast empty expanse when mapped.

I would imagine someone with some knowledge of Portuguese history could shed some light on why their descendents are found in those areas – the map, as it stands, is just a tantalizing clue in need of further explanation.

Link to full Tableau tool:

Lithuanian Americans

Lithuanian_AmericansIf you’re a Lithuanian in America,  you are not alone. But you’re close. Lithuanians are few and far between, representing one of the smaller demographic segments of the population.

In fact, out of fifty ethnic and racial ancestral demographics, Lithuanians came in tied for #36 in my list of ethnicities with the greatest number of zip codes where they’re the largest ethnic component. There was one zip code in the United States where there were more Lithuanians than any other ethnicity – zip code 17974, in Schuylkill, Pennsylvania. In that single zip code, Lithuanians make up 29.6% of the population. Go Schuylkill! Of course, that isn’t even a proper zip code – it’s a p.o. box zip code, which means it doesn’t show up as an area on my map – it shows up as a little circle that’s difficult to spot. Think of hunting for it as a Lithuanian version of “Where’s Waldo?”

Here’s a link to my Lithuanian Tableau tool:https://public.tableausoftware.com/profile/jared5561#!/vizhome/supercensus/LithuanianAmericans

Norwegians in America – our northern plains brethren

Norwegian_AmericansSome ethnic groups spread out to fill every nook and cranny in the United States – Germans, I’m looking at you! Others, like the Norwegians, stick to one region and don’t stray far. For the Norwegians, the northern stretches of the Great Plains clearly holds a special attraction.

Link to Tableau tool: https://public.tableausoftware.com/views/supercensus/NorwegianAmericans?:embed=y&:display_count=no

Italian-Americans

Italian-AmericansToday, we look at Italian-Americans – a demographic strongly concentrated in the New York / New Jersey area.  While that’s certainly the largest Italian enclave in the United States, the smaller New Orleans Italian community also shows up – giving insight into one of the many populations which make up Louisiana’s unique (and delicious) ancestral blend.

Tableau tool link: https://public.tableausoftware.com/views/supercensus/Italian-Americans?:embed=y&:display_count=no